Configuring metrics
CodeScoring stores metrics in a format supported by the Prometheus monitoring tool. Currently there are metrics available from CodeScoring platform and plugins in proxy repositories.
Collect metrics from platform
Metrics from platform are available via CodeScoring API at {platform-url}/api/metrics. In order to configure metrics tracking in Prometheus, the following steps are required:
-
open the
prometheus.ymlconfiguration file and add parameters to monitor metrics. The following is an example: -
Restart Prometheus for the changes to take effect.
-
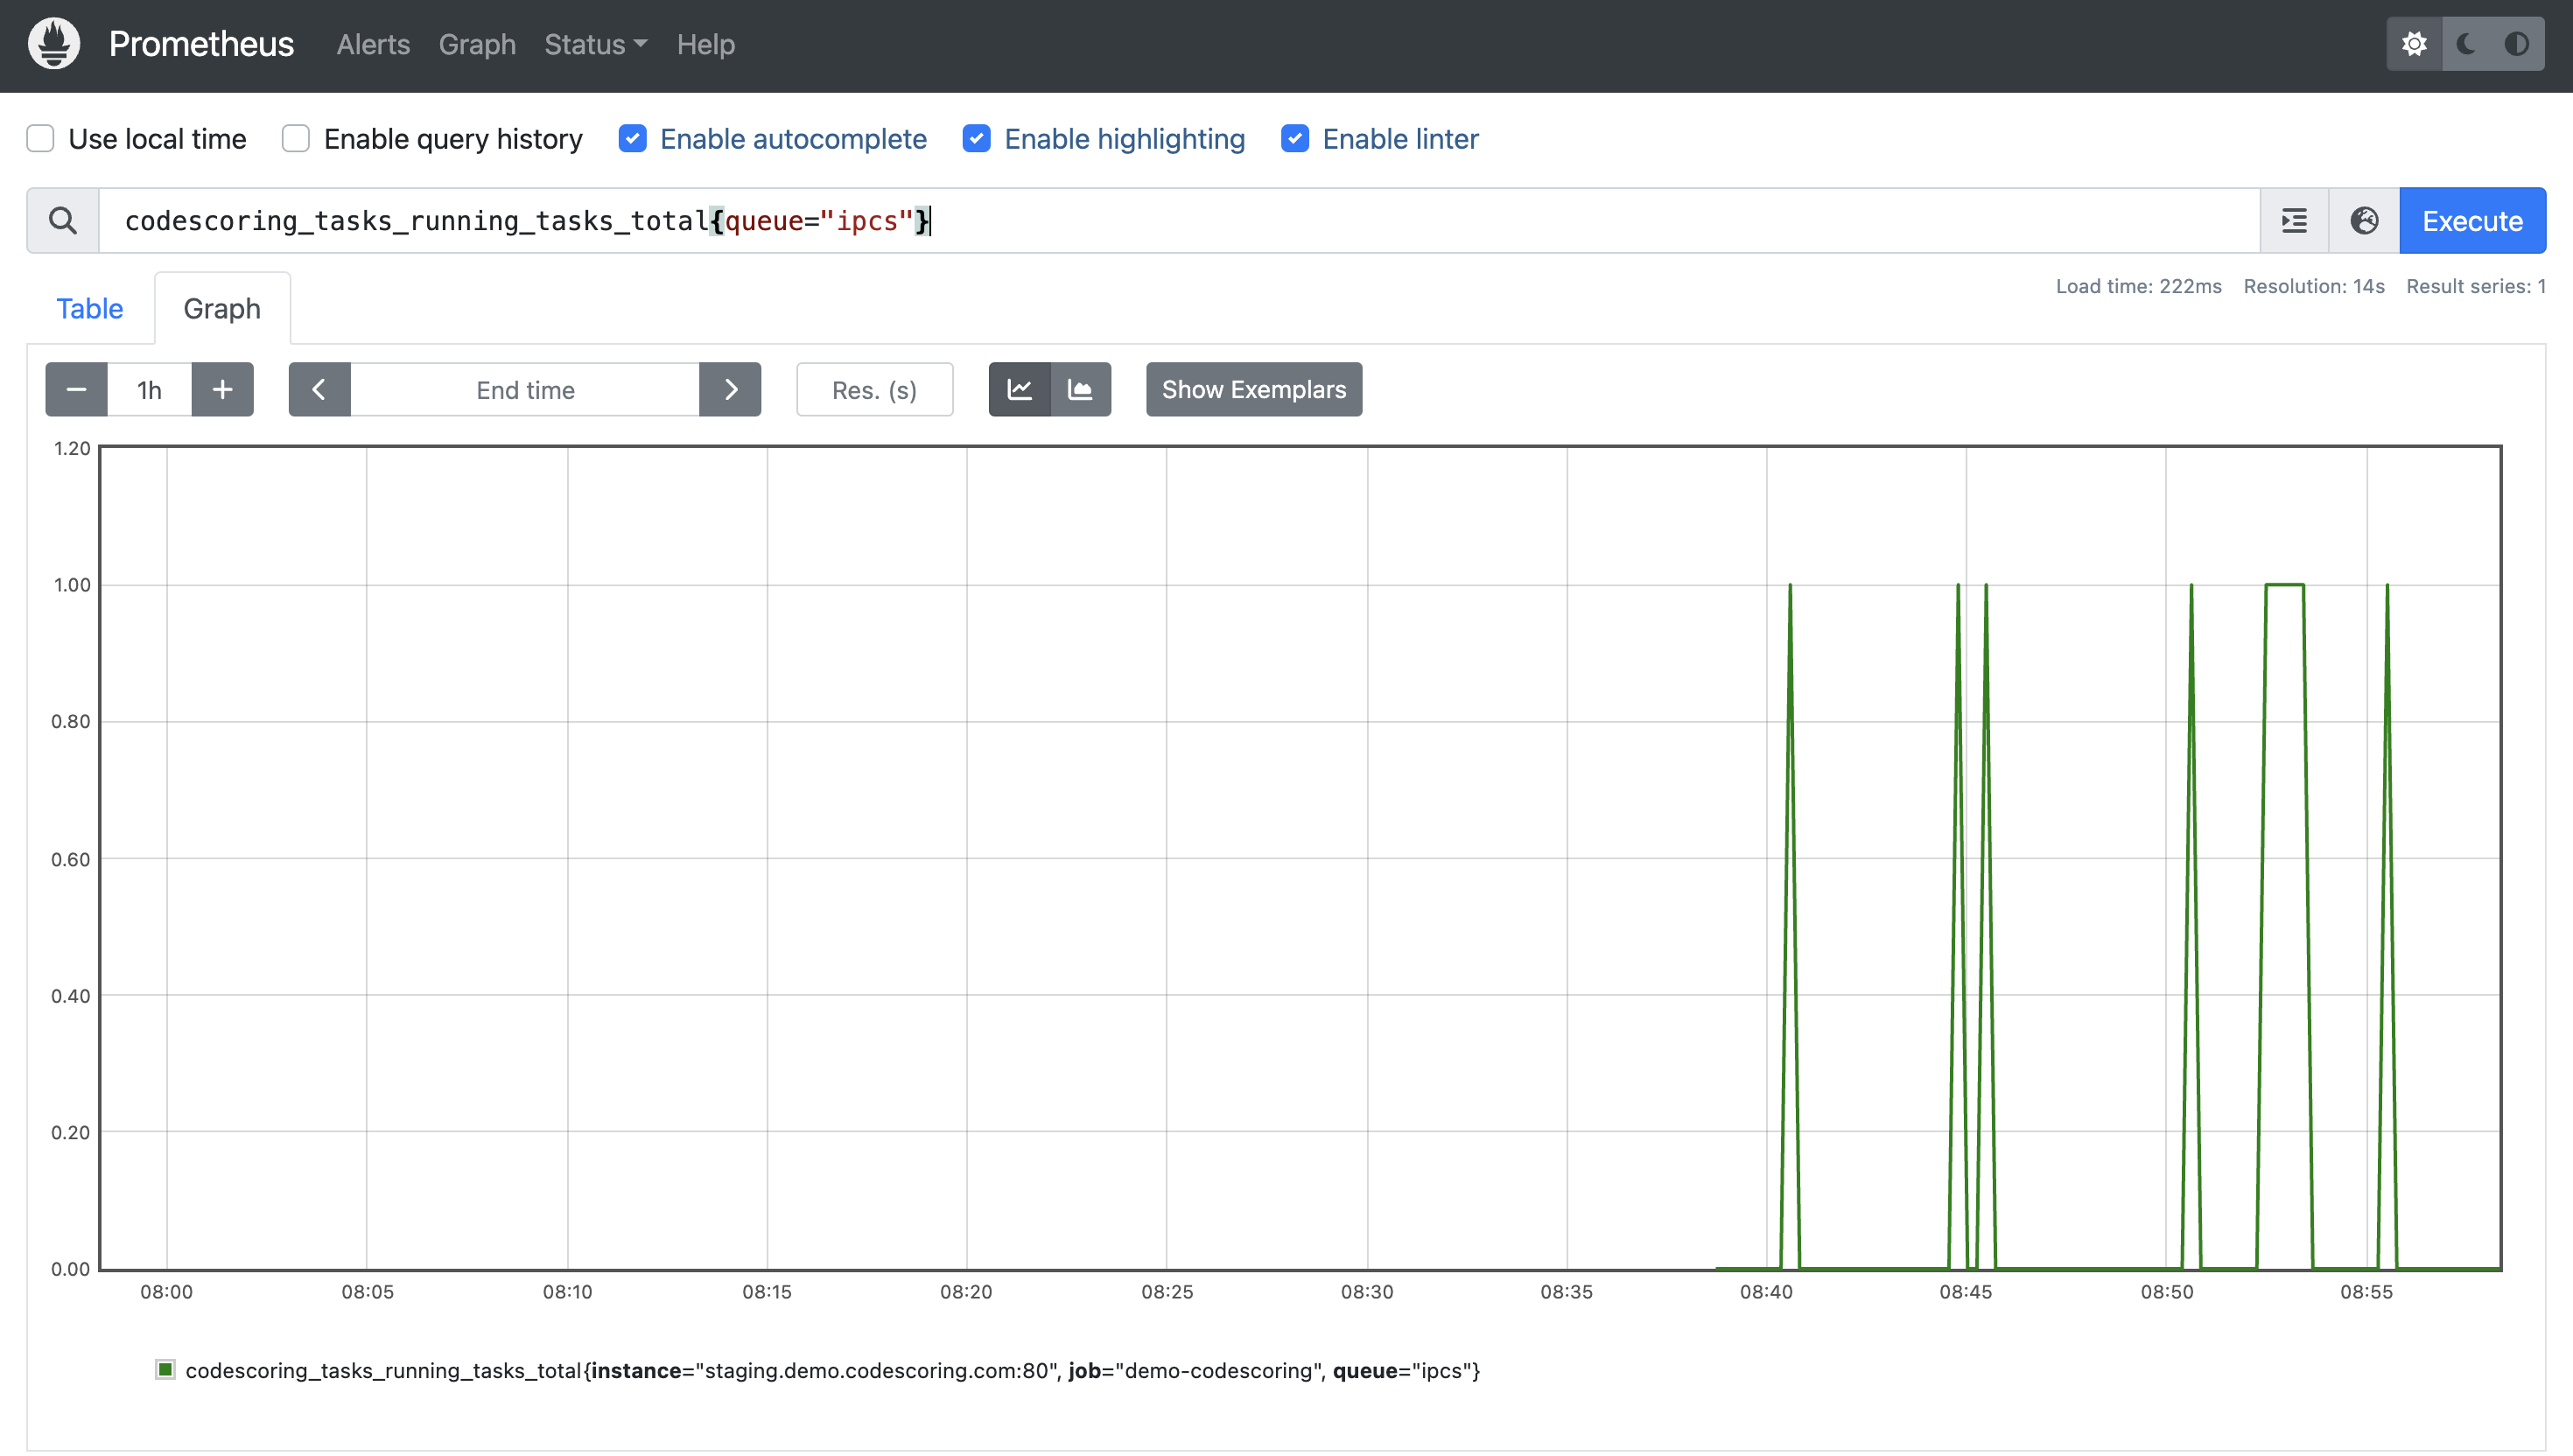
Open the Prometheus interface and go to the Graph page. In the query field, enter one of the metrics:
Queue metrics
- codescoring_tasks_queue_size_total – total number of tasks waiting to be executed;
- codescoring_tasks_schedule_queue_size_total – total number of scheduled tasks waiting to be executed;
- codescoring_tasks_running_tasks_total – total number of tasks currently running;
- codescoring_celery_queue_size_total – total number of tasks in Celery queues;
- codescoring_celery_running_tasks_total – total number of running tasks in Celery queues.
These metrics can be filtered by the queue label with the following possible values:
Main Queues:
- ipcs - main queue for asynchronous tasks;
- osa-container-image-scan - used for container image scans;
- osa-package-scan - used for scans of packages, requested through the OSA module;
- policy - used for asynchronous policy calculations;
- tqi - used during TQI analyses;
- sca-external-scan - used for SCA runs launched via Johnny CLI agent;
- secrets - used during Secrets analyses.
Celery Queues:
- default - main queue for asynchronous tasks;
- webhooks - used for webhook tasks execution;
- secrets-external-scan - used for TQI analyses launched via Johnny CLI agent;
- osa-maintenance - used for maintenance tasks related to OSA module;
- osa-background-update - used for background updates of OSA-related entities;
- oss-index - used for loading data from OSS Index in cases, when OSS Index integration is enabled;
- migration-background-tasks - used for tasks related to background recalculation of data caused by the database schema change;
- media - used for asynchronous generation of reports;
- media-cleaner - used for periodic cleanup of reports;
- sca-tasks - used for SCA-related tasks.
Analysis metrics
codescoring_running_analyses_total – total number of running analyses.
This metric can be filtered by the analysis_type label with the following possible values:
sca– dependency analysis;authors– code authors analysis;clones– code clone search.
OSA plugin request metrics
- codescoring_registration_packages_queue_size – package registration queue from OSA;
- codescoring_registration_container_images_queue_size – container image registration queue from OSA.
Example of metrics visualization:
OSA metrics collection
OSA metrics contain information about connection status, number and time of requests, as well as scan and block status of components in repository managers. Metrics are available in the CodeScoring API at {platform-url}/api/osa/metrics.
Connection metrics
codescoring_osa_api_db_connection_pool – database connection pool status.
The metric can be filtered by the measure label with the following possible values:
pool_min– minimum pool size;pool_max– maximum pool size;pool_size– current pool size;pool_available– available connections;requests_waiting– number of pending requests;pool_used– used connections.
codescoring_osa_api_redis_connection_pool – Redis connection pool status.
The metric can be filtered by the measure label with the following possible values:
available_connections– available connections;in_use_connections– used connections;total_connections– total number of connections.
Component request metrics
codescoring_osa_api_http_request_duration_seconds – HTTP request duration in seconds.
The metric is presented as a histogram and includes:
codescoring_osa_api_http_request_duration_seconds_sum– total request time;codescoring_osa_api_http_request_duration_seconds_bucket– request time distribution by time intervals;codescoring_osa_api_http_request_duration_seconds_count– total number of requests.
The metric can be filtered by labels:
handler– request handler (e.g./api/osa/packages/);method– request method (e.g.POST);status– HTTP status of the response (e.g.2xx,4xx,5xx).
Example:
codescoring_osa_api_http_request_duration_seconds_bucket{handler="/api/osa/packages/",le="0.01",method="POST",status="2xx"} 0.0
codescoring_osa_api_http_requests_total – total number of HTTP requests.
The metric can be filtered by the same labels as codescoring_osa_api_http_request_duration_seconds.
Component status metrics
codescoring_osa_api_requested_component_block_status_total – number of components in different blocking statuses.
The metric can be filtered by labels:
block_status– blocking status (e.g.not_blocked,blocked_by_policies,blocked_scan_failed);object_type– object type (e.g.package,container_image).
Example:
codescoring_osa_api_requested_component_block_status_total{block_status="blocked_by_policies",object_type="package"} 1.0
codescoring_osa_api_requested_component_scan_status_total – number of components in different scan statuses.
The metric can be filtered by labels:
scan_status– scan status (e.g.not_scanned,scanned);object_type– object type (for example,package,container_image).
Example:
codescoring_osa_api_requested_component_scan_status_total{object_type="container_image",scan_status="not_scanned"} 0.0
Index API-related metrics
index_api_failure_rate - number of sequentially failed requests to Index API.