Viewing TQI analysis results
Project page
After the analysis is complete, a detailed report containing key metrics, author information, change dynamics, and a list of commits becomes available on the project page in the TQI -> Projects section.
General project statistics
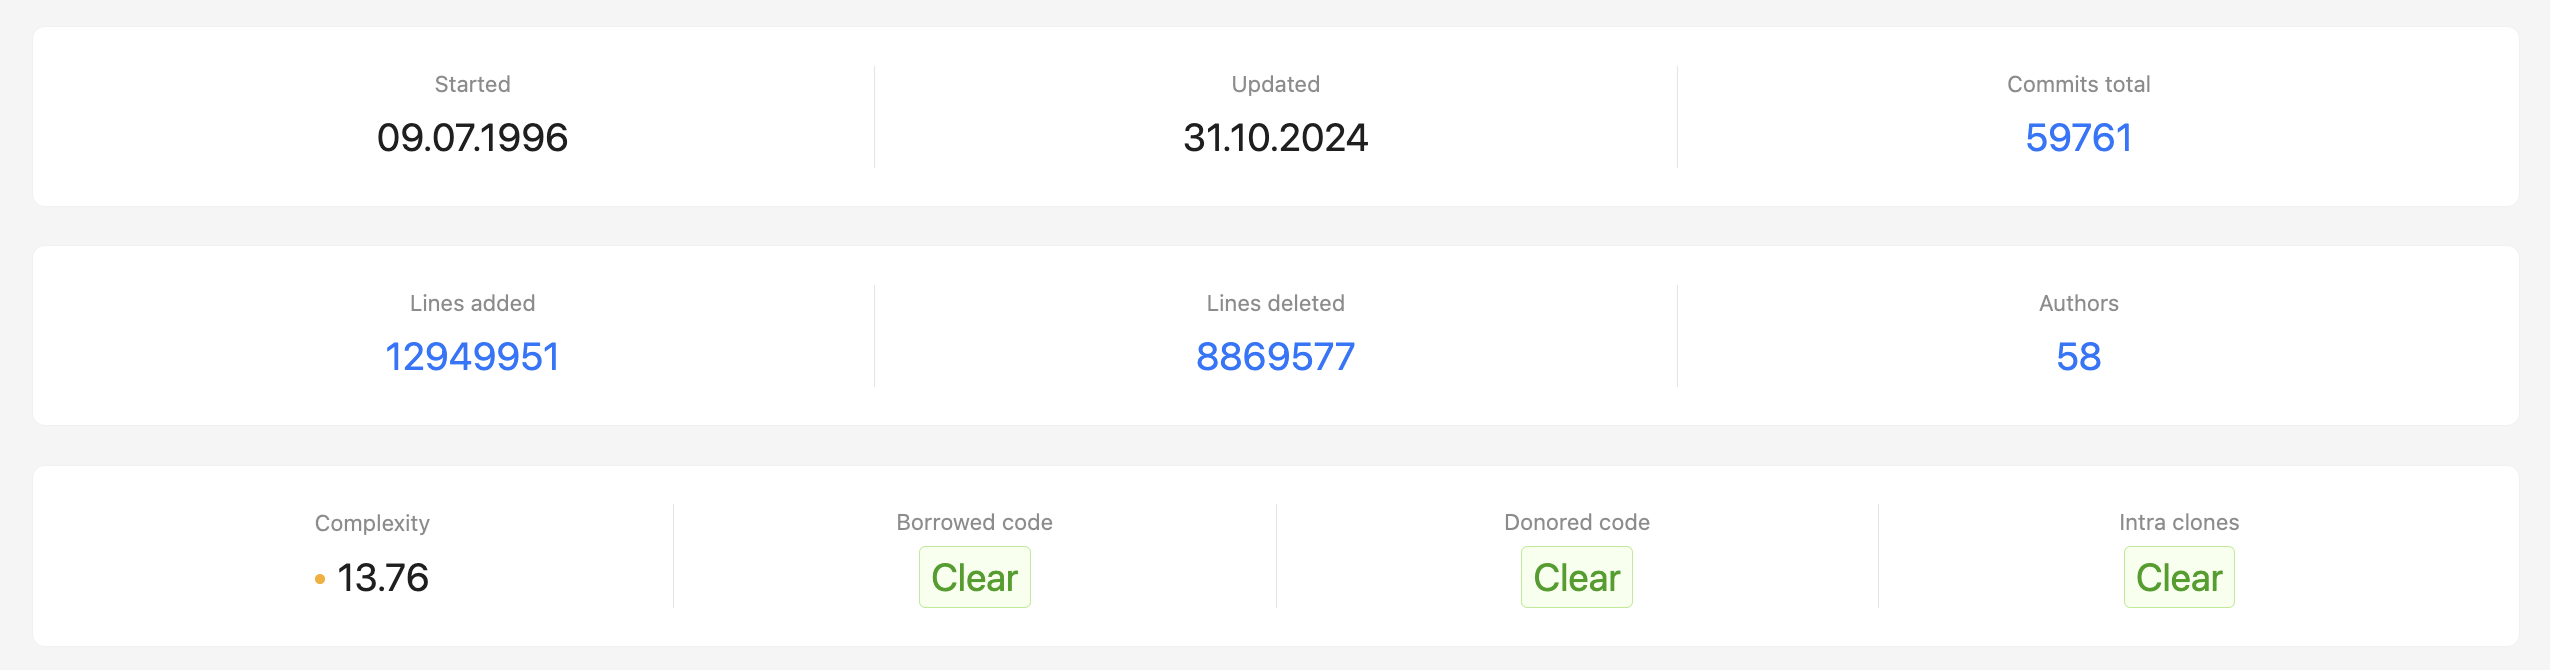
The beginning of the report records key indicators based on the analysis results:
- Started – records the moment of the first commit in the repository;
- Updated – time of the last committed change;
- Commits total – total number of commits made to the repository;
- Lines added – number of lines of code added throughout the history of the project;
- Lines deleted – number of lines of code removed;
- Authors – number of developers who made changes to the code base;
- Complexity – a code complexity indicator based on the number of branches in the program logic;
- Borrowed code – identifies sections of code that were copied from other projects within the organization;
- Donored code – identifies code fragments transferred from other projects within the organization;
- Intra clones – records duplicate sections of code within the project;
Authors
The list of authors can be viewed as a table. It is possible to change the display of columns and export the table in CSV format.
- Author – author's name and email;
- Start date – date of the author's first commit;
- Last seen – date of the author's last commit in the project;
- Activity, months – number of months during which the author actively committed changes;
- Commits – total number of commits made by the author in the project;
- Complexity – average cyclomatic complexity of the author's commits in the project;
- Clones made – number of borrowed code fragments made by the author;
- Technologies – programming languages the author works with (determined by his commits).
Project dynamics
The history of the project can be tracked by three graphs showing the dynamics of the project by three parameters:
- Lines of code & code artifacts addition/deletion history;
- Commits history;
- Commits complexity.
The time interval on the graph can be changed using the slider, choosing the period of interest for analysis.

List of commits with cyclomatic complexity calculation
For each commit, cyclomatic complexity is calculated, and its context is shown:
- Hash – unique commit identifier with a link to the version control system;
- Commit message – a short description of the changes made, specified by the author when committing;
- Commit date – date and time when the change was made;
- Lines added – number of lines of code added in the commit;
- Lines deleted – number of lines removed in the commit;
- Complexity – cyclomatic complexity value calculated based on the changes made;
- Author – name of the developer who made the commit.
Results visualization
Activity map
The activity map is available in the TQI –> Projects section on the Activity map tab. It displays all the contributions of authors for the selected time period for a set of projects, which can be filtered by the following parameters:
- Commit Date – period during which the commit was made in the version control system;
- Number of Projects – total number of projects displayed on the map;
- Proprietor – part of the organization that manages the project;
- Project category – category assigned within the CodeScoring system;
- Technologies – programming languages used in the creation of the project.
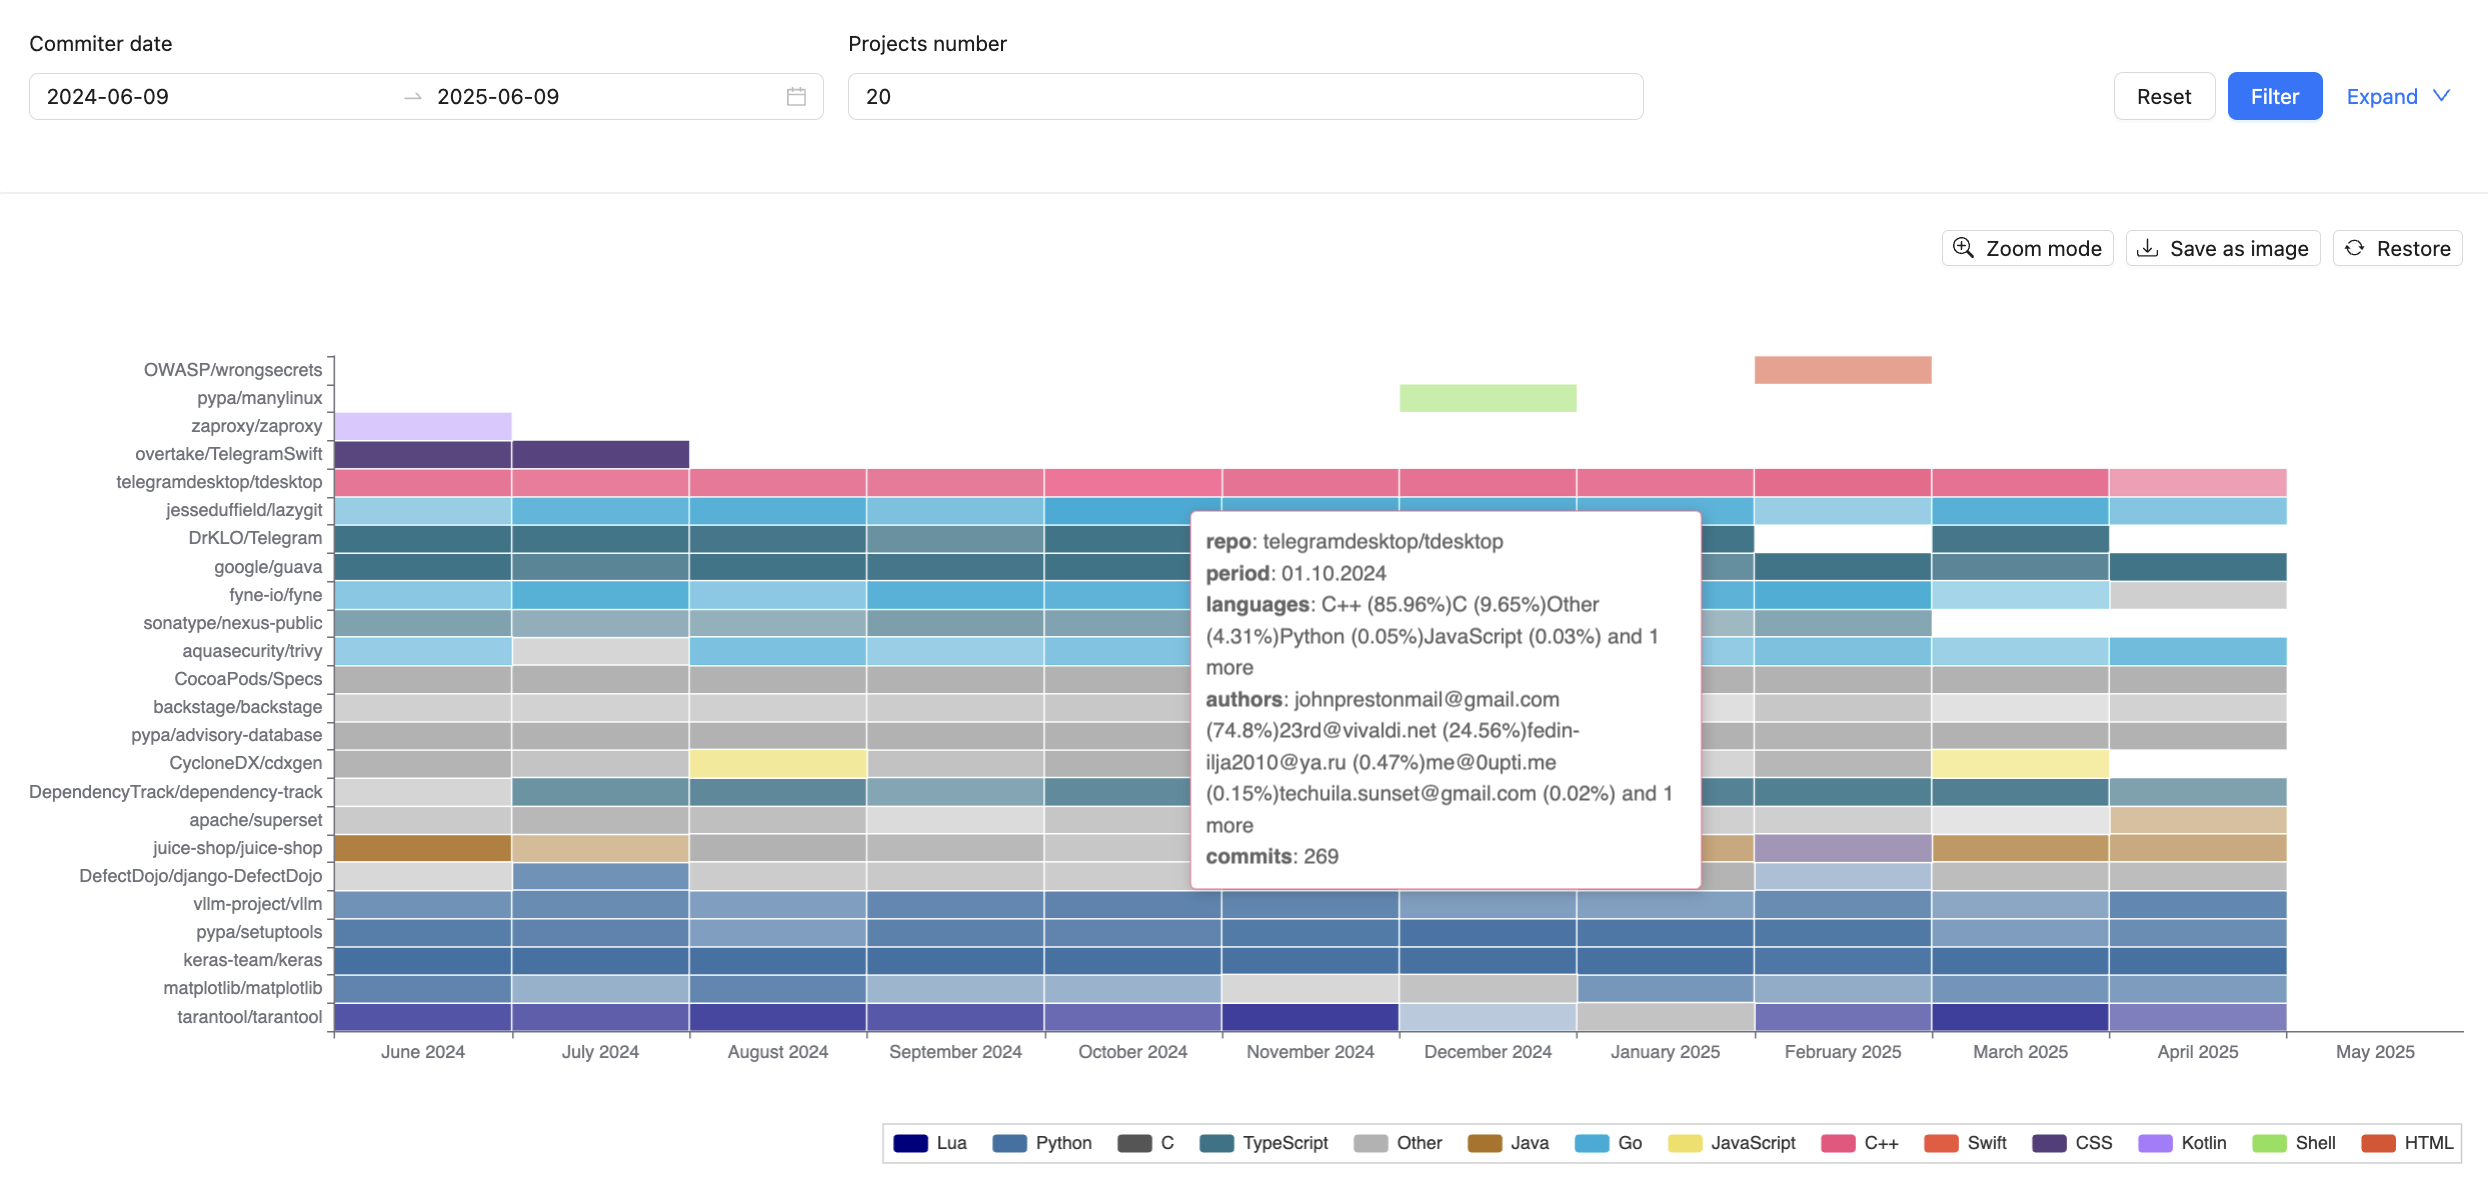
The map can also be saved as a PNG image.
Complexity map
The complexity map is available in the TQI –> Projects section on the Complexity map tab. It displays the change in the complexity of a set of projects, which can be filtered by the following parameters:
- Commit Date – period during which the commit was made in the version control system;
- Number of Projects – total number of projects displayed on the map;
- Proprietor – part of the organization that manages the project;
- Project Category – category assigned within the CodeScoring system;
- Technologies – programming languages used within the project.
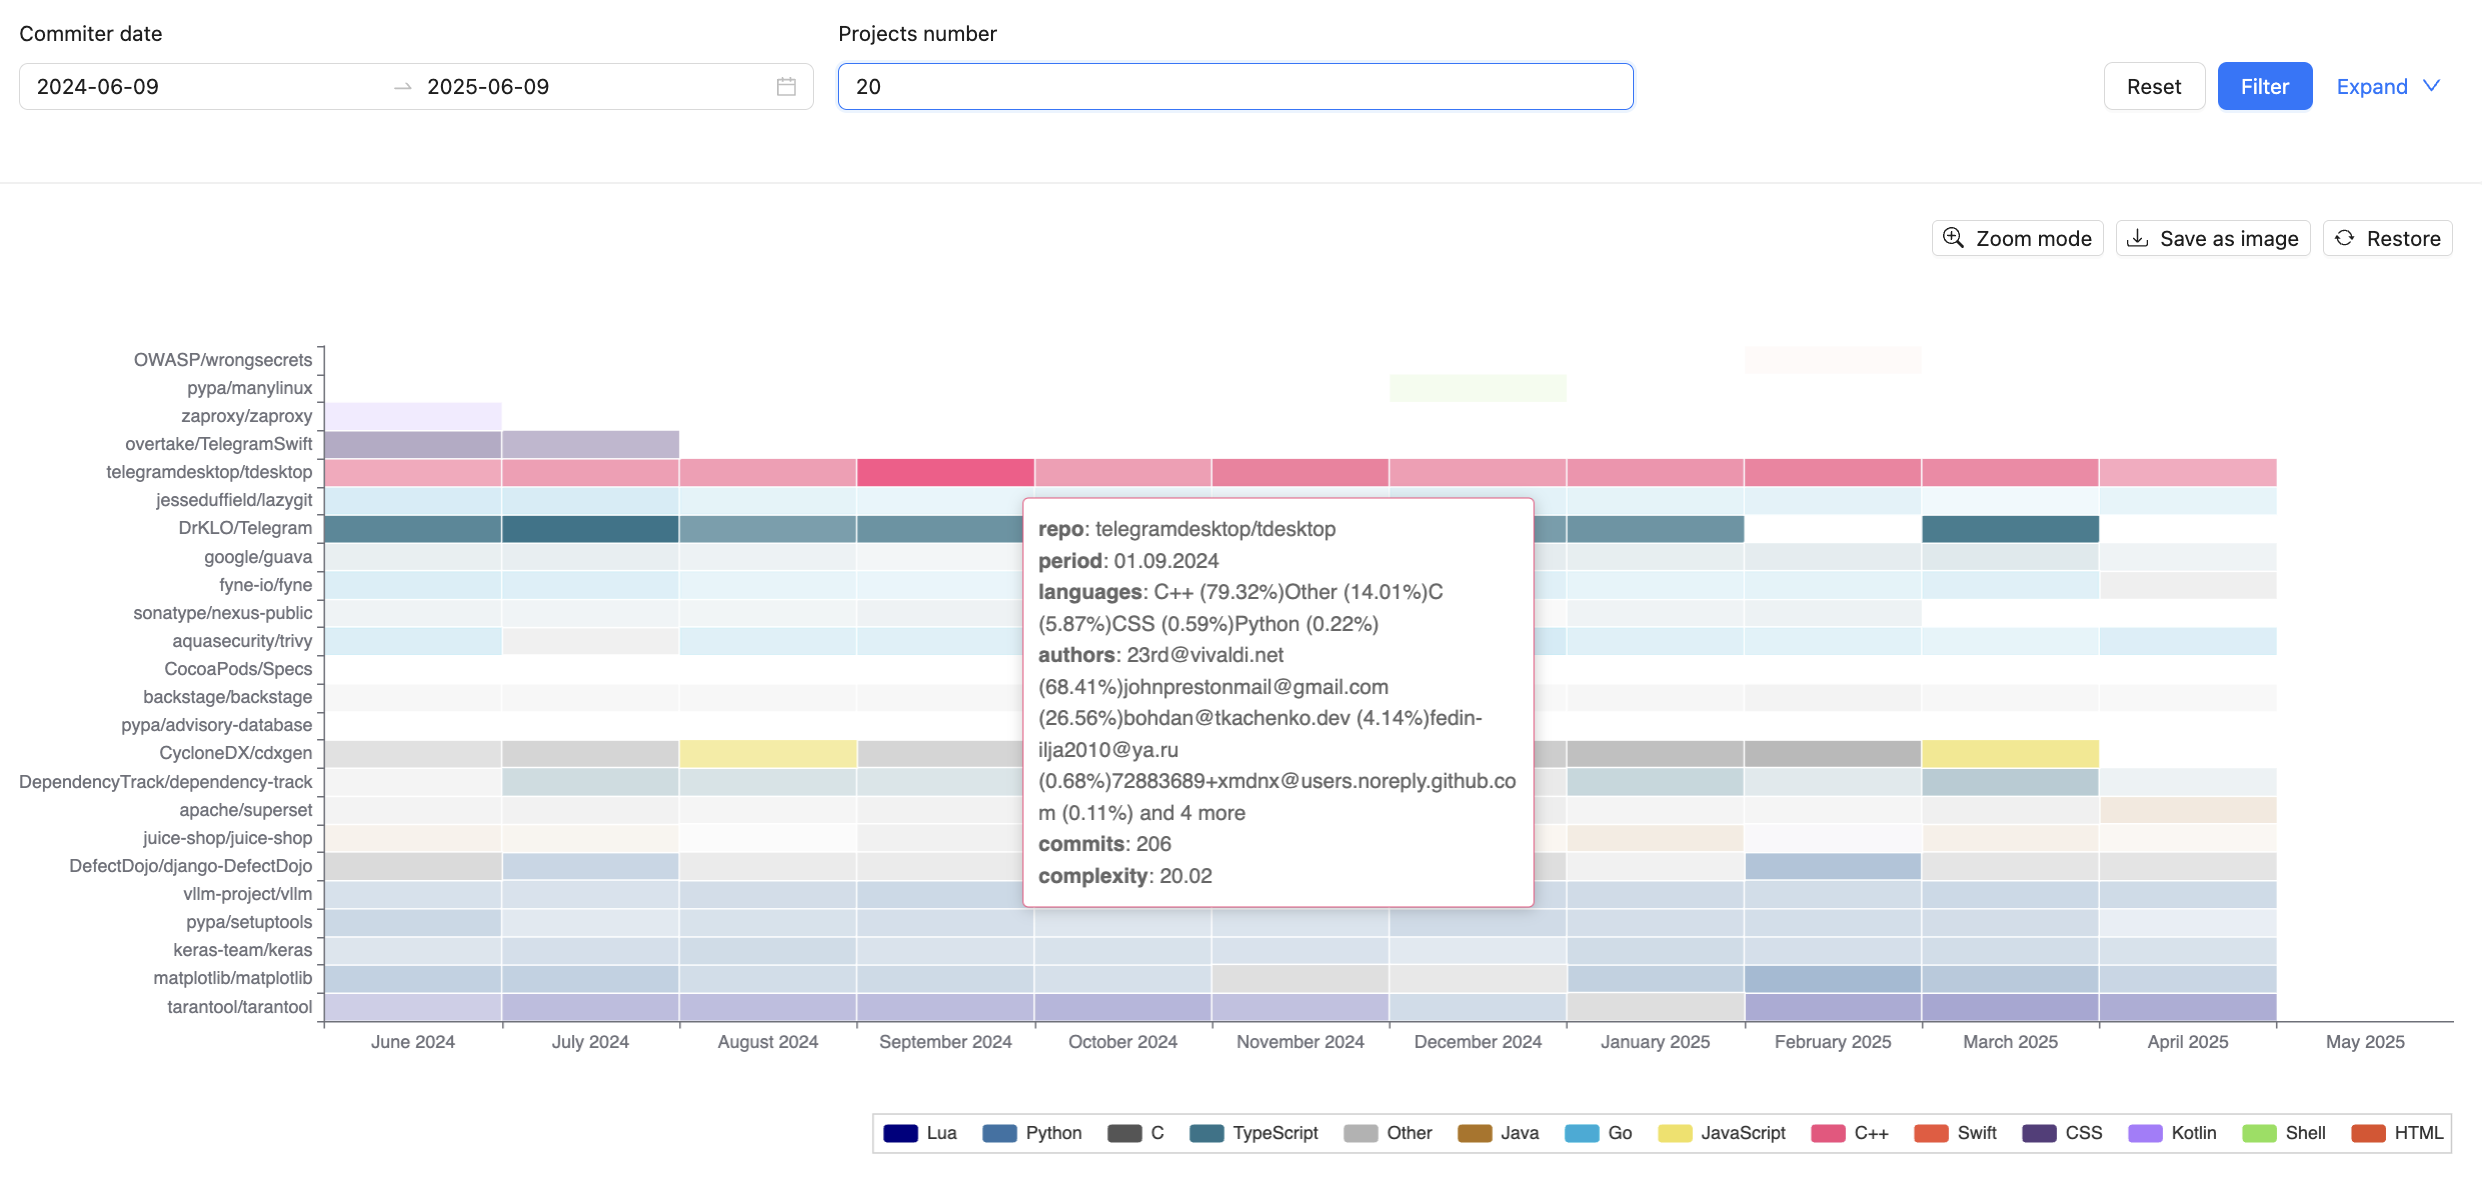
The map can also saved as a PNG image.