Vulnerability reachability analysis
Reachability analysis checks whether a potentially vulnerable piece of code can actually be executed when using the application. This allows filtering out the "noise" and focusing on exploitable issues.
Johnny CLI agent can analyze whether vulnerabilities are reachable from source code. To use this feature, you need to set two parameters:
cg-path— path to the call graph file: forjava,python,go,kotlin, andcsharp(C#), use the Svace format; forjavascript, use JSON produced by Joern (see below);cg-lang— programming language for which the call graph was built. Supported values arejava,python,go,kotlin,csharp(C#), andjavascript.
Building the call graph
Using Svace
-
Download the Svace module
https://REGISTRY_USERNAME:REGISTRY_PASSWORD@REGISTRY_URL/#browse/browse:files:codescoring%2Fsvace-callgraph -
Obtain a user token in CodeScoring (
/cabinet/profile) -
Run Svace on the project's source code. This step is best performed within or after the build stage in your CI/CD pipeline.
- Initialization
- Instrumented build
Example of building Java project:Example for Go:Example for Python:Example for Kotlin:Example for C#:
- Analyze results and generate the call graph
- Initialization
-
Upon successful completion of all steps, a file named
.svace-dir/analyze-res/call-graph-results/<project_name>-graph-order.jsoncontaining the call graph will appear in the project directory.Saving a filePrior to Svace version 5.0.260311, the call graph file was saved to the folder
.svace-dir/analyze-res/call-graph -
Launch the scan using Johnny, for example:
Using Joern (JavaScript)
For JavaScript, the reachability call graph is built with Joern. Run the following in the directory that contains your project source code:
The joern-parse command creates a CPG in cpg.bin. The joern-slice usages command writes JSON output. By default the file is slices.json in the current folder. Pass the path to that file in Johnny’s --cg-path argument. You can set the output file explicitly with joern-slice’s -o option; see Joern CPG slicing documentation.
Example scan invocation:
Remote analysis
In Svace 5.0.260311, it is now possible to use a remote analysis server. This allows you to take the construction of the call graph beyond the CI/CD pipeline, reduce the load on the assembly servers and optimize the continuous integration process.
Server configuration steps
- Specify environment variables
- Initialization
- Start the server
-
Submit the project for analysis. After configuring the server, you do not need to specify the
--license-server-urland--license-server-tokenlicense parameters.If necessary, you can add the parameters:
--port,--login,--pass, etc.
For more information about the remote analysis server settings, see the Svace documentation.
Viewing results
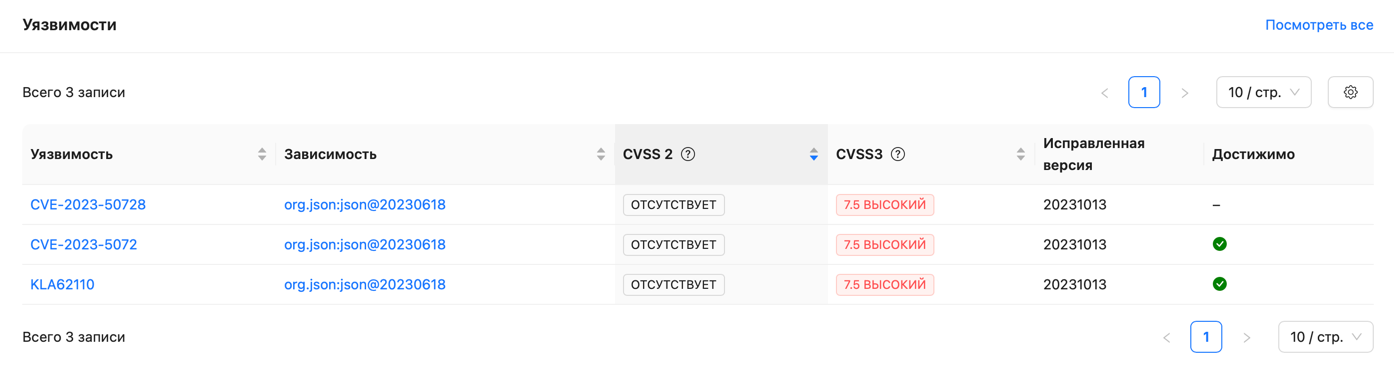
In the vulnerabilities table, vulnerabilities with identified reachable call paths will be marked in the corresponding column:
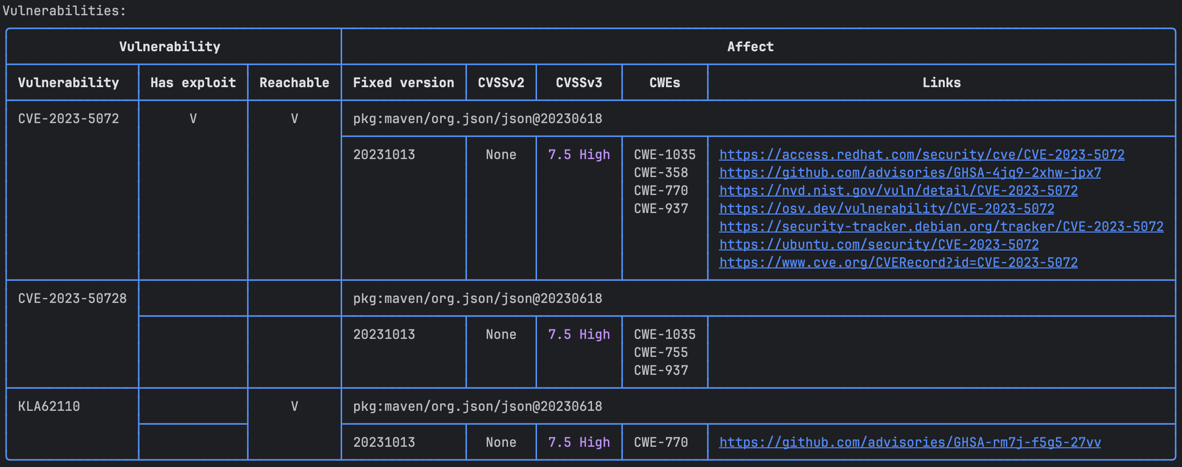
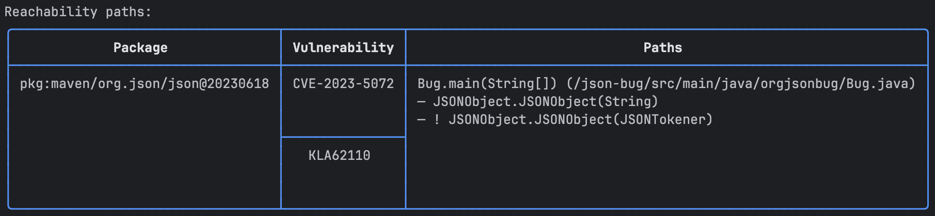
Additionally, at the end of the report, another table listing the call trees for vulnerabilities will be available:
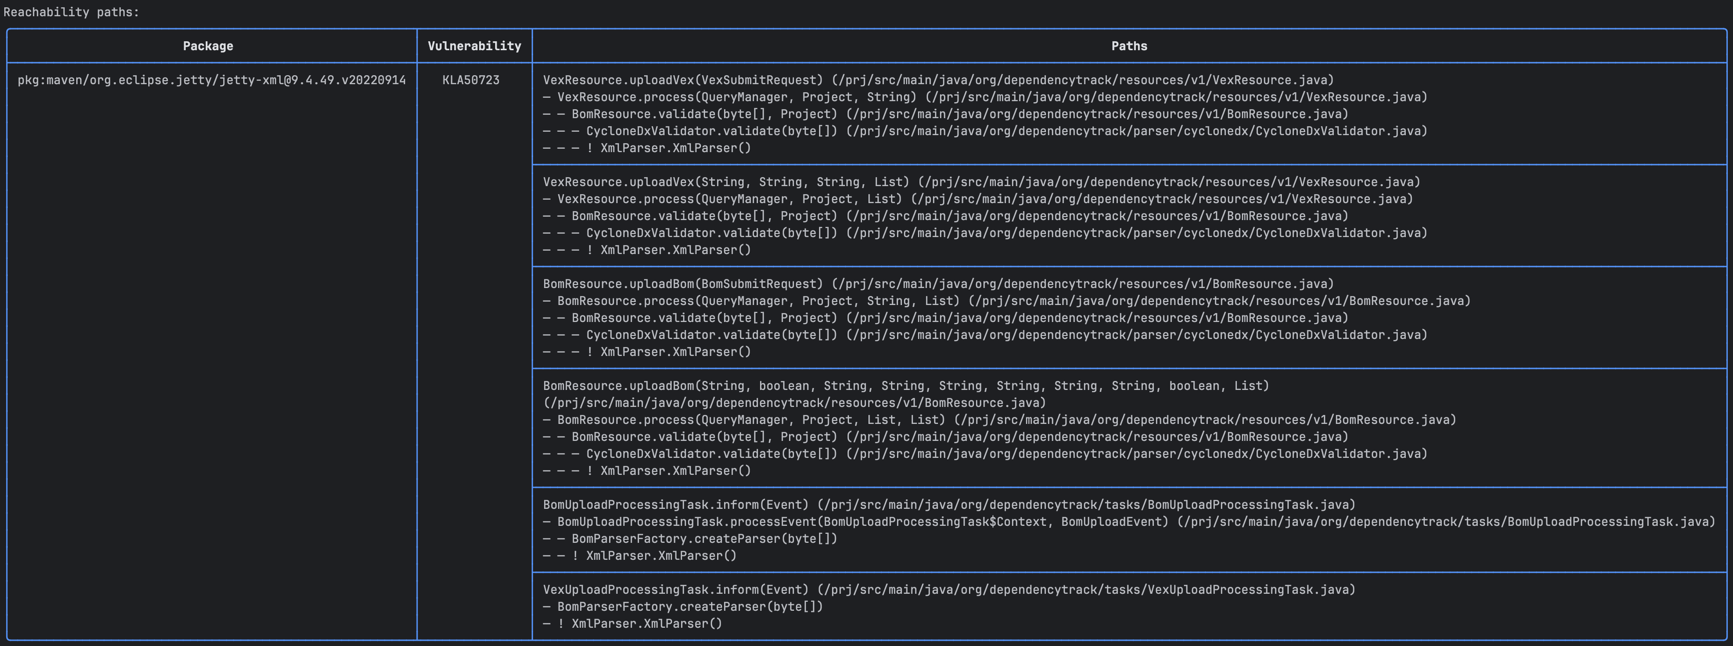
Example for a larger project:
If the --save-results flag was specified, reachability results will appear in the "Reachable" column of the vulnerabilities table: